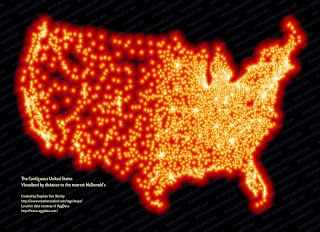
Dot Density Maps illustrate density by placing symbols such as dots in approximate location of the variable of interest. Dot maps are used only for raw data not data that is expressed as a ratio. Examples of dot density maps include farms and population distribution in a particular region. The following map displays the locations of McDonald's across the United States. The vast amount of these fast food chains greatly contribute to the obesity epidemic in the US.

No comments:
Post a Comment