Environmental Sensitivity maps provide summaries of possible resources that may be at risk.
This map illustrates the agricultural usefulness of the Fresno area. Fresno County is a rich agricultural area in California that is facing rapid urbanization
and farmland conversion. The county is engaging in a strategic,
multi-county planning initiative that seeks to sustain the land while making regional cohesive decisions regarding the land.
Wednesday, June 6, 2012
Topographic Maps
| Within the limits of the specified scale, topographic maps illustrate as accurately as possible the location and shape of both natural and man-made features. Natural features include relief, and hydrographic features, such as lakes and rivers, while man-made features include other characteristics of the subject area of interest, such as cities, towns, roads, railroads, canals, dams, bridges, and parks, etc. These are simple topographic maps of Montego Bay and the entire island of Jamaica. I visited Montego Bay, Negril, and areas surrounding Kingston. |
Proportional Symbol Map
The proportional symbol map uses differing sizes of symbols to
represent data associated with varying areas or map locations. The following map depicts the number of Autism cases in Wisconsin. The varying circle sizes represent the specified count listed in the key.
Dot Density Maps
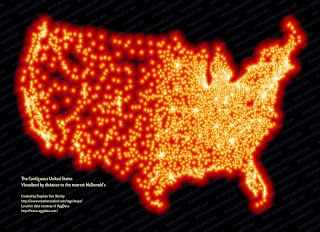
Dot Density Maps illustrate density by placing symbols such as dots in approximate location of the variable of interest. Dot maps are used only for raw data not data that is expressed as a ratio. Examples of dot density maps include farms and population distribution in a particular region. The following map displays the locations of McDonald's across the United States. The vast amount of these fast food chains greatly contribute to the obesity epidemic in the US.
Chloropleth Maps
Subscribe to:
Comments (Atom)


